关于美国经济由超级富豪支撑的担忧常被夸大。一个常被引用的统计称,收入最高 10% 的家庭贡献了约 一半 的消费,而收入最高 20% 的消费占比从 2019 年的 55% 上升到 2025 年的 59%。然而,这些数字主要来自通过收入与储蓄差额推算消费的方法,并依赖关键假设,例如收入最高 10% 家庭持有约 70% 的股票,因此也被假定承担 70% 的股票购买。这种用历史资产占比推断当前储蓄流量的做法可能导致严重偏差。
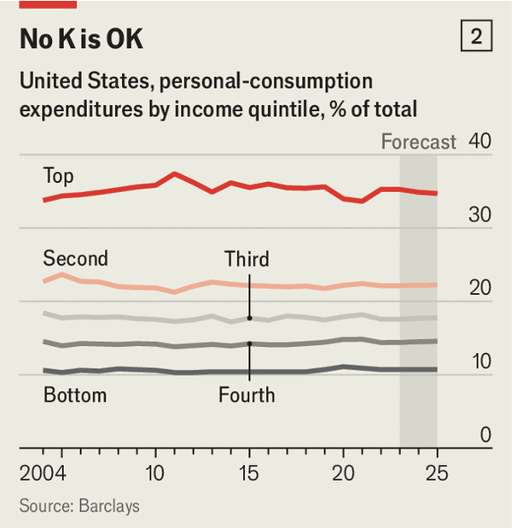
更直接的调查数据显示不同结论。美国劳工统计局的消费调查经巴克莱银行经济学家调整后表明,收入最高 20% 的家庭只占 略高于三分之一 的总消费,而非接近一半。该比例在几十年间基本稳定,即使经历 2007–2009 年全球金融危机和 2020 年疫情冲击也未显著改变。进一步分析显示,在 2025 年富人偏好的消费类别增长并未明显领先,甚至使高收入群体消费占比略微下降。
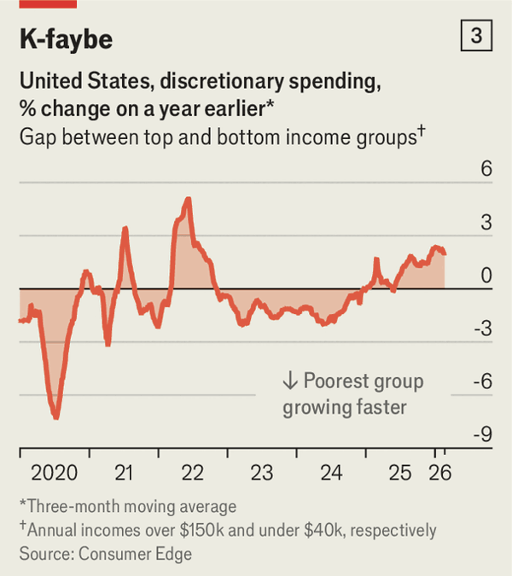
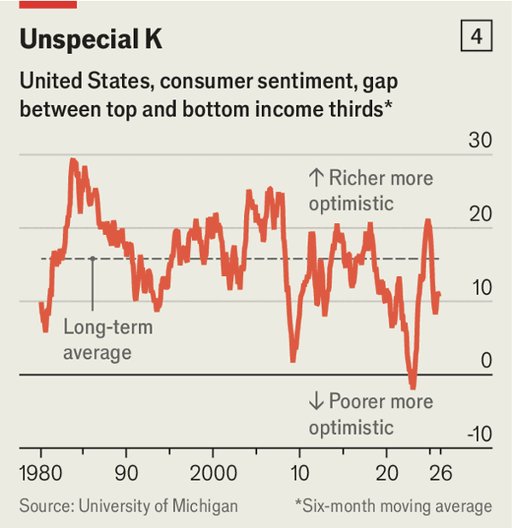
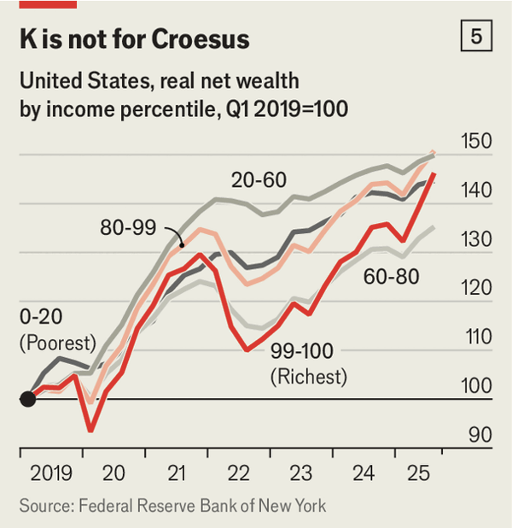
其他数据同样未显示明显的“K 型”分化。基于信用卡与借记卡交易的数据表明,富人与其他群体的消费增长差距在过去几年反复波动,但平均 接近零。工资方面,低收入者的收入增长速度与高收入者 大致相当,并在疫情后的几年 更快。资产方面,疫情以来富人净资产并未持续快于其他群体增长:富人财富在 2022 年因加息导致市场下跌而大幅回落,而较低收入家庭财富增长更慢但更稳定。因此,美国经济增长并非仅由富裕阶层驱动。
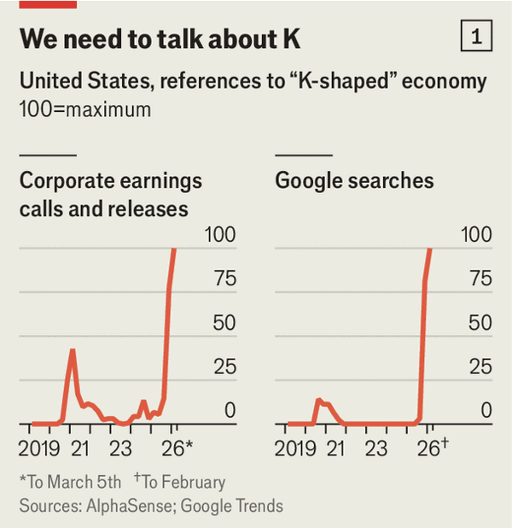
Concerns that the American economy depends mainly on the spending of the super-rich are often overstated. A frequently cited statistic claims the top 10% of earners account for about half of all consumption, while the top 20% increased their share from 55% in 2019 to 59% in 2025. However, these estimates derive spending as the difference between income and saving and rely on strong assumptions, such as the top 10% holding roughly 70% of equities and therefore being assumed to account for 70% of stock purchases. Using historical asset shares to infer current saving flows can introduce substantial error.
More direct survey evidence suggests a different picture. Data from the Bureau of Labor Statistics, adjusted by Barclays economists, indicate the top 20% of earners account for only just over one-third of total consumption rather than nearly half. This share appears remarkably stable over decades, even through the 2007–2009 global financial crisis and the 2020 pandemic. Analysis of spending categories also shows that goods and services favored by wealthier households did not grow faster in 2025, and the rich share of consumption may have edged slightly lower.
Other indicators likewise fail to show a strong “K-shaped” divergence. Credit- and debit-card data suggest the gap in spending growth between rich households and others has fluctuated but averaged around zero in recent years. Wage growth among lower-income workers has been similar to that of higher earners and was faster in the years immediately after the pandemic. Asset data also show that since the pandemic the net worth of rich households has not consistently outpaced that of poorer ones; wealthy households saw large declines during the 2022 market slump, while lower-income households experienced slower but steadier gains.