这种定价与公开杠杆贷款的表现形成鲜明对比:Morningstar LSTA 美国杠杆贷款指数中软体与服务部门的贷款,今年以来已亏损近 6%。在存量结构方面,大型企业借款人仍主导第一留置权贷款,但过去 1 年内,upper-middle 与 middle-middle market 公司的占比正在上升。Kroll StepStone 将 large corporate 定义为最近 12 个月 EBITDA 超过 1.5 亿美元,且营收与借款均高于 7.5 亿美元;较小区间则落在 EBITDA 7,500 万至 1.5 亿美元与 2,500 万至 7,500 万美元,营收与借款约 3.75 亿至 7.5 亿美元及 1.25 亿至 3.75 亿美元。
最关键的统计讯号是,过去 10 年美国与欧洲新私募信贷贷款的整体利差已降至新低,但这发生在借款人利息保障倍数中位数接近 10 年低点、而美国杠杆又并不低的背景下。以 180 天回溯期观察,图表显示的并非「保障较弱对应较高利差」的正常对角线,而是从「尚可保障下的高溢价」移向「保障偏弱下的低利差」。文章因此认为,大量资金,尤其寿险资本流入,可能压缩了风险溢酬;在估值依赖模型与新发行定价的市场中,私募信贷的平稳报酬或许反映成熟化,也或许反映接近自满的定价。
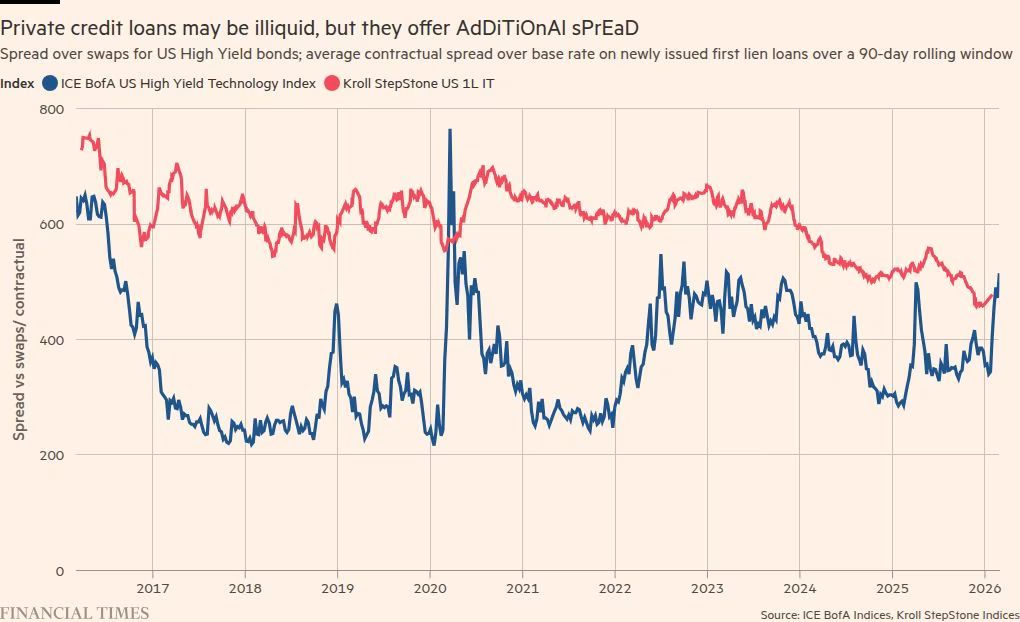

Kroll LLC and StepStone have built a private-credit benchmark set that covers roughly two-fifths of the market, excluding leases and structured finance. The latest snapshot includes almost 3,000 loans with a combined par amount of just over $1tn, about 2 times the value held by public and private business development companies. The data helps show how contractual spreads on newly originated US technology private-credit loans have moved: spreads have widened, but only slightly, and in some cases investors are being offered higher spreads in the public high-yield tech bond market than in the deeply illiquid private-credit market.
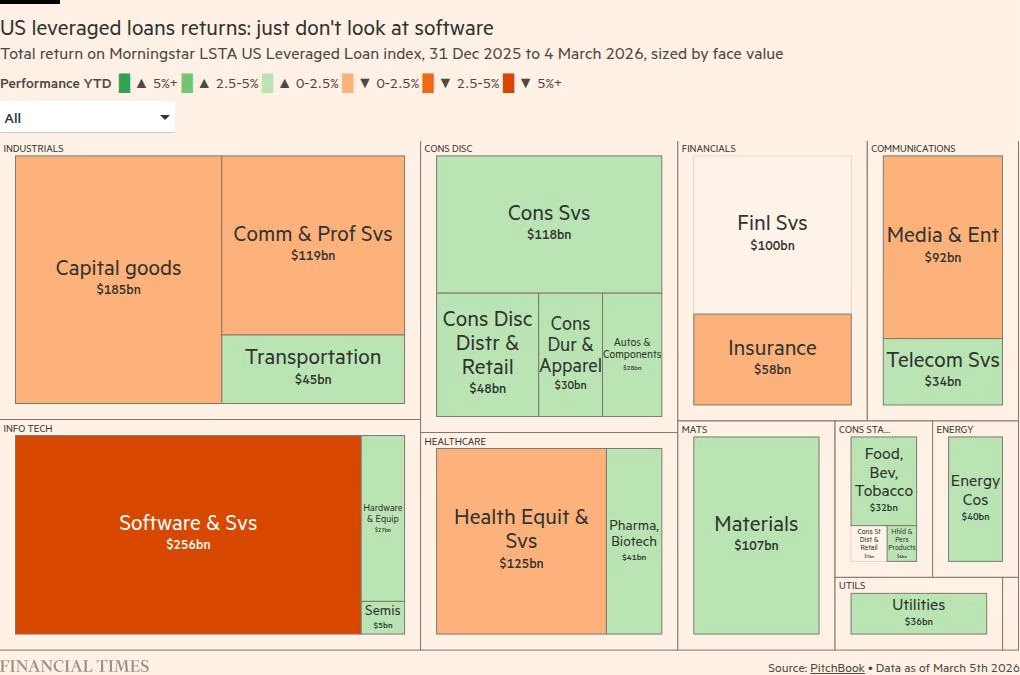
That pricing looks striking against public leveraged-loan performance: loans in the software and services segment of the Morningstar LSTA US leveraged loan index are down almost 6% year to date. In the stock of loans outstanding, large corporate borrowers still dominate first-lien private credit, but upper-middle and middle-middle market firms have gained share over the past year. Kroll StepStone defines large corporates as borrowers with last-12-month EBITDA above $150mn and both revenue and borrowings above $750mn; the smaller bands run from $75mn-$150mn and $25mn-$75mn of EBITDA, with revenue and borrowings around $375mn-$750mn and $125mn-$375mn.
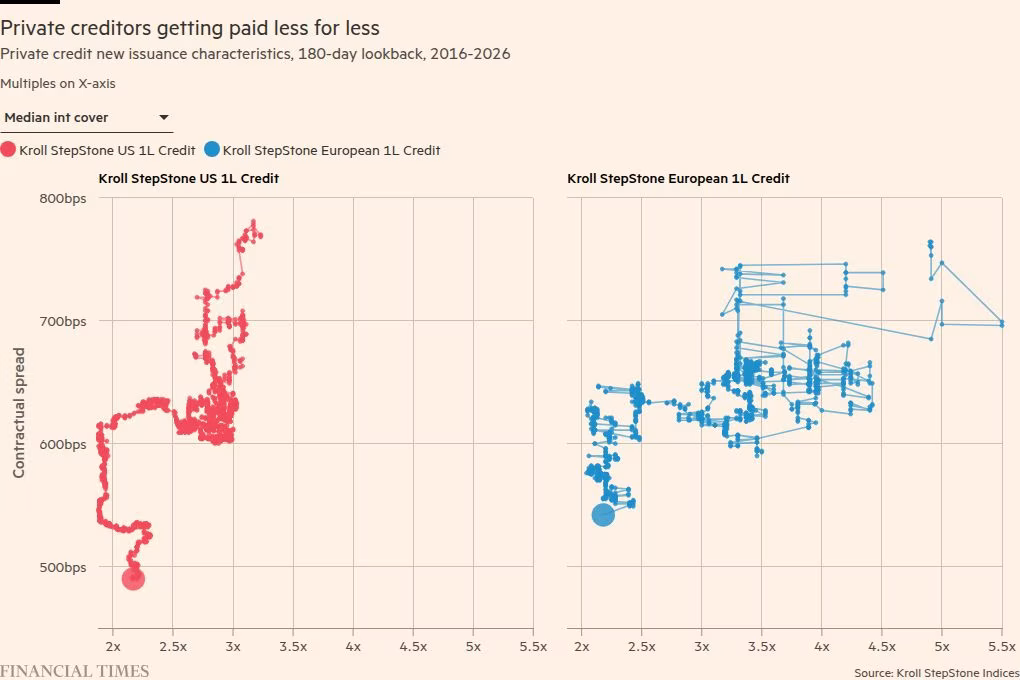
The most important statistical signal is that overall spreads on new private-credit loans in the US and Europe are hitting new lows even as median borrower interest cover is near decade lows and US leverage is not especially low. Using a 180-day look-back, the chart shows not the normal diagonal of weaker cover paired with higher spreads, but a shift from fat premiums for acceptable cover to thin spreads for thin cover. The article therefore argues that heavy capital inflows, especially from life insurers, may have compressed risk premia; in a market where valuations rely on models and new-issue pricing, private credit's smooth returns may reflect maturity, but they may also reflect pricing close to complacency.